Bring in the Processors
Investigation of Pods effect when placed on a car for aerodynamic performance in terms of drag reduction.
Streamline DrivingCFD – The Modern Equivalent of Wind Tunnel Testing
Our question was simple: Show us what our fuel savers can do? Or, in scientific terms,
“The objective of this project was to investigate AeroHance Pods effect when installed on a car for aerodynamic performance in terms of drag reduction.”
Computational aerodynamic performance modeling analysis conducted by the world’s largest independent Computational Fluid Dynamic (CFD) focused provider of engineering simulation software, support and services, concluded that a kit of 10 AeroHance Pods placed along the rear roof of a vehicle traveling 35 and 65 mph expanded, organized, and enhanced the airflow to result in a reduction of the vehicle’s drag coefficient by around five percent (5%).
Adding our fuel saving devices along the rear side of the vehicle further reduced its drag coefficient by an additional 1.6% – 6.7%. This translates into an improvement in fuel consumption for the test vehicle of just under 1.3 mpg, or an extra 18 miles for its 14.5 gallon tank.
Based on the foregoing, you can multiply 1.25 by the number of gallons your gas tank holds to calculate how many extra miles per tank you can expect to drive before next filling up.
To test our fuel saving devices, we retained the services of a firm that specializes in Computer Fluid Dynamic (CFD) analysis for the transportation industry. Their client list includes NASA, Boeing, Mercedes Benz, Ford, and Harley Davidson.
Methodology
Computational Fluid Dynamics (CFD) is an analysis tool to predict physical fluid flow and heat transfer using computational methods, and was chosen as the preferred method for second stage of product viabiliity verification. A CFD provider with 30 years of experience working with 3000 different companies, from 30 offices around the globe, and spending over $165 million on their software and services were retained to conduct the study.
The objective of the project was to investigate the effect of Aerohance Pods installed on a car for aerodynamic performance in terms of drag reduction. A 3D CAD geometry of a production personal vehicle (VW Golf IV two door) was selected and purchased. Four CFD models were created using STAR-CCM+.These models represent a baseline geometry of the vehicle and three geometries with our fuel saving devices installed.
The computational models were generated based on standard mesh settings for external aerodynamic analyses with appropriate refinement particular to this model.
The drag coefficient predicted from the baseline model was compared against the published data for the vehicle, and found to be within an acceptable range for control. Analyses were performed for the vehicle speed of 35 and 65 miles/hour for the baseline (without Pods), and with Pods installed in 3 different configurations.
Summary & Conclusions
CFD results show that installing our fuel saving devices on the rear roof of the car reduces the drag coefficient by about 0.0186, which is equivalent to 5.24 % reduction in drag. CFD results from installing AeroHance Pods on the rear part of the car, namely c-pillar and the rear roof reduces the drag coefficient by about 0.024, which is equivalent to 6.76% reduction in drag.
It is well known in the literature that the strength of a pair of longitudinal trailing vortices formed on the side edges of the slanted rear of a car are directly associated with its base pressure. The high negative base pressure induced by the strong longitudinal vortices result in high drag. Reduction in the strength of the longitudinal vortices weakens the downwash between them, which results in increase in base pressure.
Presence of AeroHance Pods fuel savers in the growing boundary layer decelerates the downstream flow, which results in a pressure rise inside of the shear layer. This pressure rise propagates through the shear layer into the base region of the vehicle. Presence of AeroHance Pods on the roof causes increase in base pressure of the vehicle in the wake region, which results in reduction in drag.
PREDICTION OF AERODYNAMIC PERFORMANCE OF AN AFTERMARKET VORTEX STABILIZER
Read the full ReportDrag and Drag Coefficient
A drag force is a component of the resultant force on an object that is parallel to the freestream.
A drag force on a vehicle consists of two contributions: pressure (or form) drag and skin friction drag.
Pressure drag is the stream-wise component of the pressure force integrated over the entire vehicle while skin friction drag is the stream-wise component of the shear force (friction between the air and vehicle surface) over the vehicle.
Aerodynamic performance of various vehicles is often described by a drag coefficient which is independent of the vehicle speed and shape (area). The drag coefficient of a vehicle remains close to constant over the range of typical highway speeds (45 to more than 100 mph).
A drag coefficient is defined by the following formula:
Since a drag coefficient remains relatively constant in a typical range of operations, a drag force varies with density (altitude), frontal area of the vehicle, and vehicle speed. For a certain vehicle model at a certain altitude, a drag varies only with vehicle speed as shown at the left.
Appendix
Frontal area is the projected area of the vehicle onto the plane normal to the flow direction.
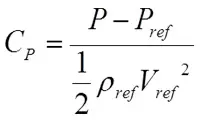
Pressure coefficient is another non-dimensional variable used to represent pressure (force per unit area).
The following values were used to convert dimensional variables such as drag, pressure, and shear stress to corresponding non-dimensional variables while reference values are arbitrary.
The values to the left were used to convert dimensional variables such as drag, pressure, and shear stress to corresponding non-dimensional variables while reference values are arbitrary.